If you want to succeed in the stock market, you must understand how to read stock charts. These charts help you visualize a stock’s price movements over time, showing whether it’s going up, down, or staying the same. Think of them as a financial weather report. Stock charts allow investors to track performance and spot patterns, helping them decide the best time to buy or sell. They don’t guarantee success, but they do reduce guesswork.
Most stock charts show data through candlesticks, lines, or bars. These are like the “language” of the market. Once you learn how to read them, you can interpret market emotions, trends, and trading volume. This skill separates serious investors from casual guessers. Whether you’re looking at day trading or long-term investing, stock charts are your map in the market jungle.
Types of Stock Charts
Line, Bar, and Candlestick Charts Explained
Stock charts come in several types, but the three most common are line, bar, and candlestick charts. A line chart is the simplest, it connects closing prices over time, giving you a clear picture of a stock’s direction. If you’re just beginning to learn how to read stock charts, line charts are a great place to start.
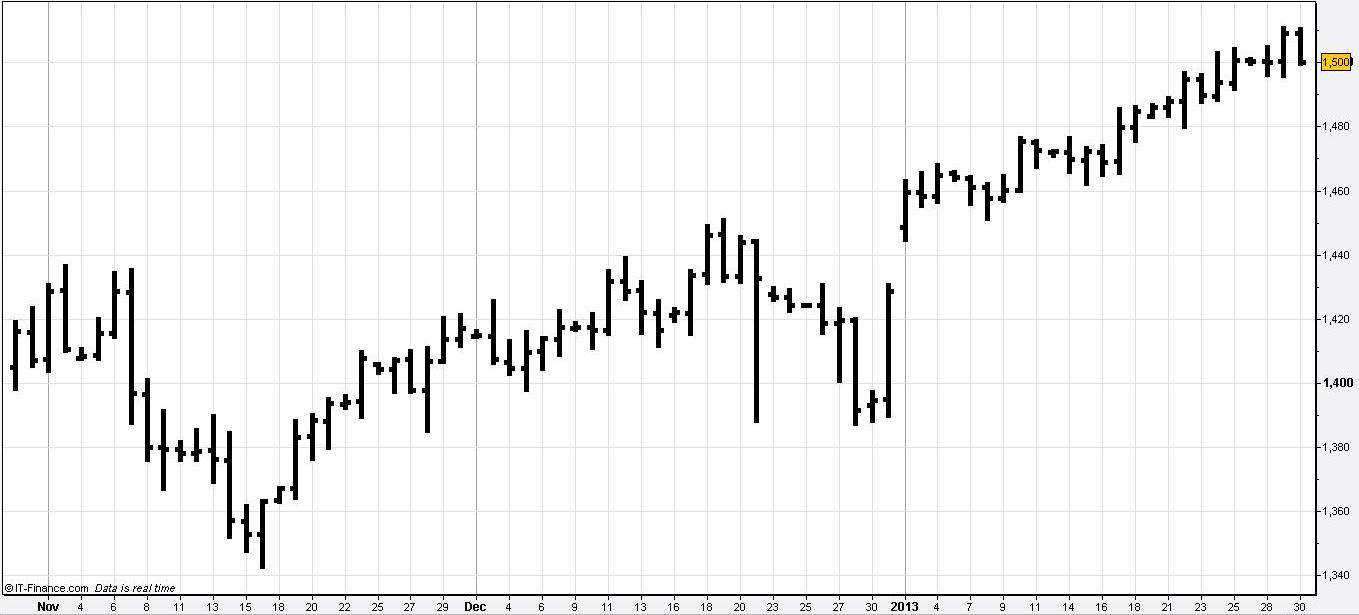
Bar charts add more detail. Each bar shows the opening, closing, high, and low prices for a particular time. They’re helpful for spotting volatility and price ranges. On the other hand, candlestick charts are more visual and popular among traders. Each “candle” shows four key values: open, close, high, and low. Green candles typically show gains, and red candles show losses.
Learning the difference between these chart types is like choosing between Google Maps, Apple Maps, or Waze, they all take you to the same place but with different visuals and tools.
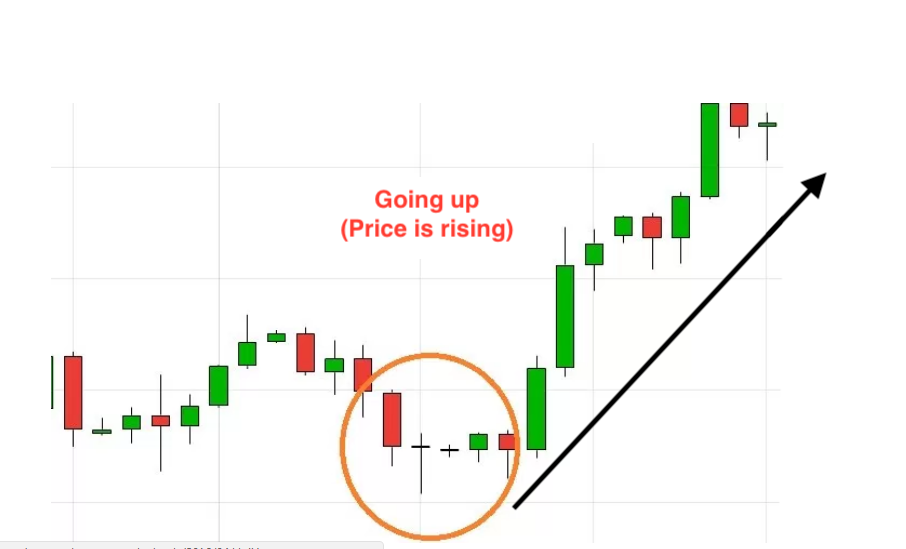
Candle Stick Chart
Timeframes and Intervals
Daily vs Weekly vs Intraday Charts
Time is an important element when you read any stock chart. The same stock might look strong on a weekly chart but weak on a daily or hourly chart. So, when you’re learning how to read stock charts, always ask yourself: What time frame am I analyzing?
- Daily charts show the stock’s movements in one-day candles or bars.
- Weekly charts combine five daily sessions into one candle/bar.
- Intraday charts (like 5-minute or 1-hour) are useful for short-term traders.
For long-term investors, weekly or monthly charts give a broader view of the trend. But if you’re a day trader or swing trader, intraday and daily charts matter more. Always match the chart interval with your trading strategy.
Recognizing Chart Patterns
Common Patterns That Traders Follow
Learning how to read stock charts includes recognizing popular chart patterns. These patterns help traders guess the future based on the past. Some of the most common ones include:
- Head and Shoulders: A reversal pattern indicating a trend change.
- Double Top/Bottom: Suggests that a stock is struggling to move past certain levels.
- Cup and Handle: Often seen before an upward breakout.
- Triangles (Ascending, Descending, Symmetrical): Show periods of consolidation and potential breakouts.
Recognizing these patterns early gives you an edge. They don’t work every time, but they do increase your odds of success when used with other tools like volume and indicators.
📚 Read More: Sukanya Samridhi Yojana: Daughter’s future Scheme
Trendlines and Moving Averages
How to Track the Market Direction
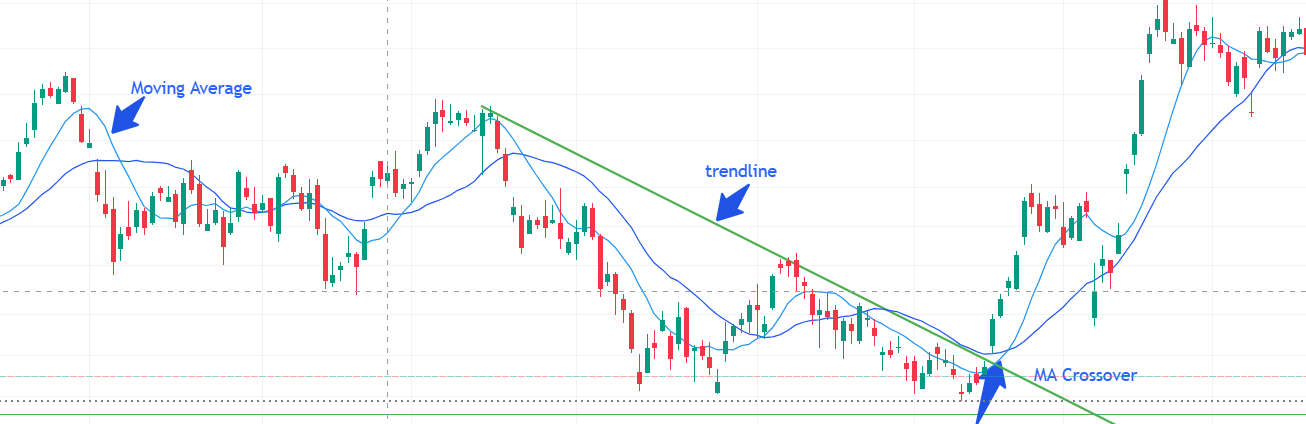 One of the first things traders do is draw trendlines on stock charts. These are straight lines connecting highs or lows, showing the stock’s overall direction—uptrend, downtrend, or sideways. Understanding these trends is essential when learning how to read stock charts.
Another tool is the moving average. It smooths out price data to show the stock’s average over a time period, like 50-day or 200-day. A rising moving average suggests bullish behavior; a falling one suggests bearish.
Traders also look for crossovers, where short-term and long-term moving averages cross paths. For example, if the 50-day MA crosses above the 200-day MA, it’s called a “Golden Cross”, a bullish sign.
Volume and Indicators
Using Volume and Technical Indicators
While price shows direction, volume shows strength. Volume is the number of shares traded during a specific period. If a stock rises on high volume, it’s a strong signal. Low volume during a move may mean the trend is weak.
 Other key indicators include:
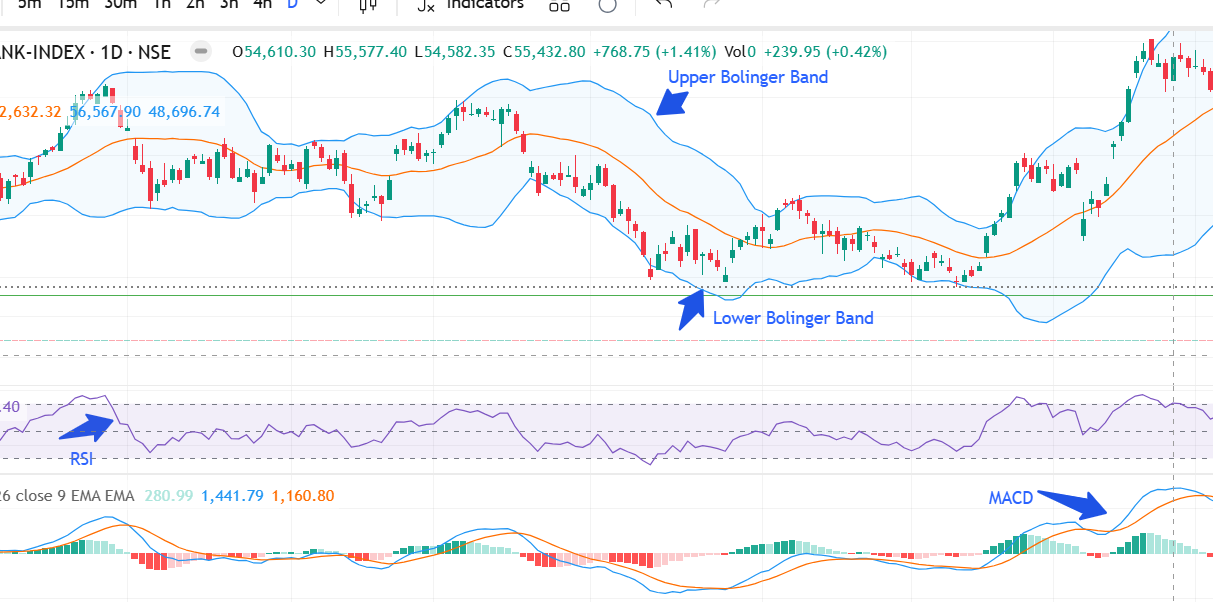
- Relative Strength Index (RSI): Tells if a stock is overbought (>70) or oversold (<30).
- MACD (Moving Average Convergence Divergence): Tracks momentum and trend direction.
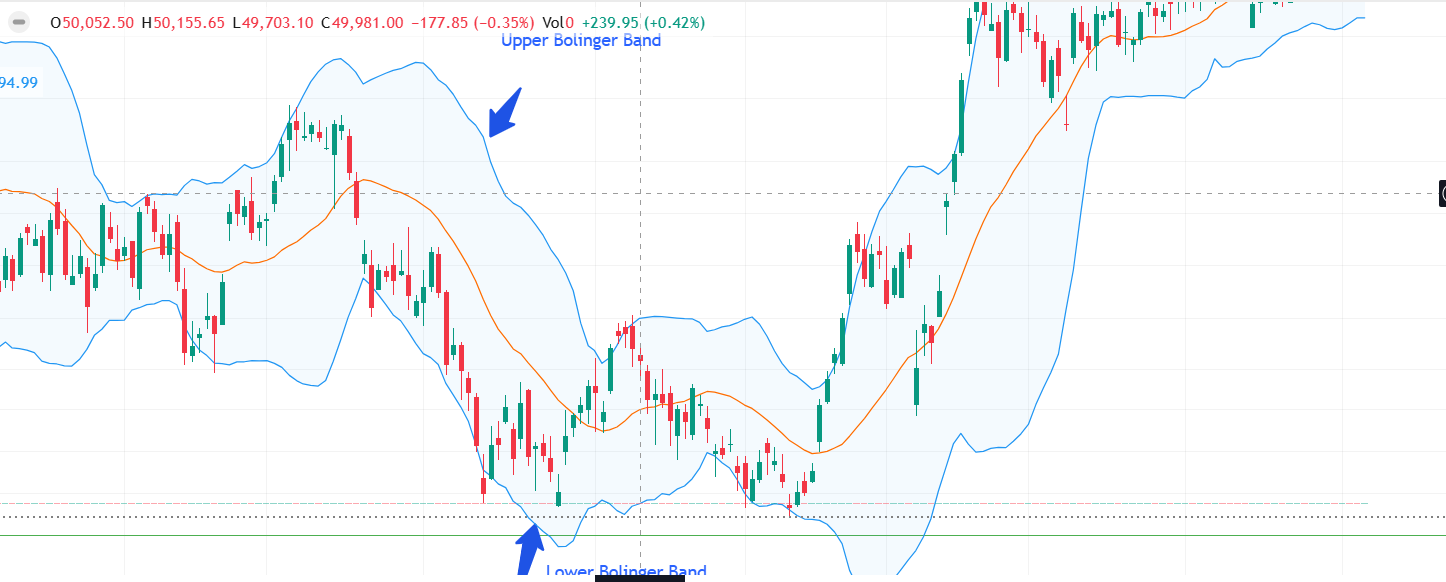
- Bollinger Bands: Show volatility and price deviation.
These tools add more insight when learning how to read stock charts, but don’t use them in isolation. They work best when combined with chart patterns and trendlines.
📚 Read More: Is Stock Market a Game or Business?
What to Look for Before Entering a Trade
A Checklist to Help You Analyze Charts
Before making a trade, use this simple chart-reading checklist:
Trend Analysis
- Is the stock in an uptrend or downtrend?
- Are trendlines clear and unbroken?
Pattern Recognition
- Any familiar patterns forming?
- Is it a breakout or breakdown scenario?
Volume Confirmation
- Are volume levels supporting the price move?
- Is there a spike or drop in volume?
Indicator Signals
- Is RSI in a favorable zone?
- Are moving averages showing a crossover?
Using this checklist makes your analysis more structured. It also helps prevent emotional decisions, especially when charts look noisy or unclear.
📚 Read More: The History of Stock Market
Practice and Real-Time Charting Tools
Tools That Help You Improve Chart Reading
Now that you know how to read stock charts, it’s time to practice. Real-time tools and websites allow you to view, draw, and analyze charts. Some of the most popular tools include:
- TradingView: Offers free and paid charting tools with social features.
- Investing.com: Easy-to-use interface for beginners.
- Yahoo Finance: Basic charting for quick analysis.
- MetaTrader: Great for advanced users.
Among the best tools for beginners is GoCharting, a free and browser-based platform that offers powerful charting features, including chart replay. This feature allows you to practice reading stock charts by replaying past market movements, candle by candle, just like watching a live session. It helps improve your timing, pattern recognition, and decision-making without risking real money. If you’re serious about learning how to read stock charts, GoCharting provides one of the most effective environments to sharpen your skills with real-time simulation.
These platforms let you draw trendlines, set alerts, and add indicators. Try studying the same stock across different timeframes and indicators. The more charts you review, the faster you’ll build this important skill.
Conclusion: Chart Reading Is a Lifelong Skill
Learning how to read stock charts isn’t about predicting the future, it’s about understanding the present with the help of the past. Like any skill, it improves with practice and patience. Whether you’re a beginner or seasoned investor, chart reading helps you make smarter, more confident decisions. As you dive deeper, you’ll find your own favorite patterns and tools. What matters most is consistency and a calm mindset. Always combine technical reading with sound risk management and never rely on one signal alone.